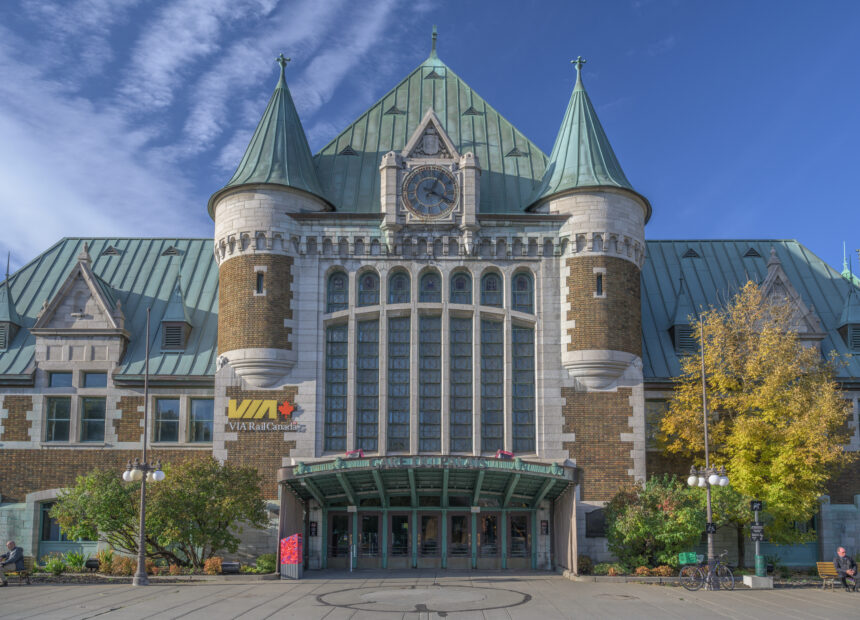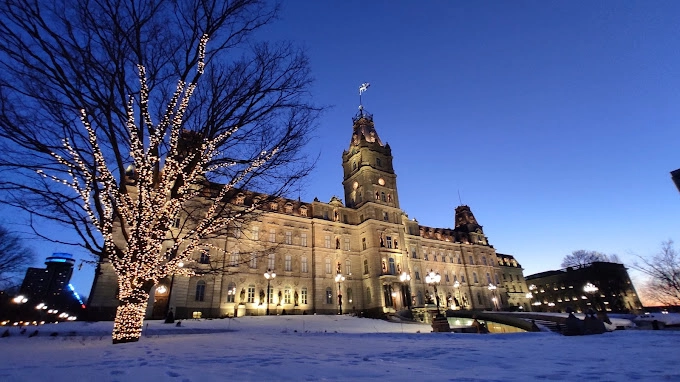



Visitors to the Québec City tourism region made 6.7 million tourist stays in 2025 and spent $2.7 billion, according to Destination Québec cité, the regional tourism board. Tourism supports 34,643 jobs in the region (Apport économique du tourisme, Région touristique de Québec 2025). The visitor mix skews domestic in a way that is unusual among Canadian destinations, and that shapes almost everything else about how the city trades.
One caution about that first number, because it is easy to misread. The board’s 2025 fact sheet counts stays, not individual people, and its earlier releases counted tourists. A stay averages 2.1 nights and $405 of spending. So the 6.7 million figure is not comparable with the 4.3 million tourists reported for 2024, and the two should not be read as a jump.
For first-time visitors
The visitor mix is unusual among Canadian cities. Most Canadian tourist destinations skew heavily toward American or European visitors; Québec City skews domestic to a degree that surprises people who have not seen the numbers. On the 2025 fact sheet, Quebecers account for 77% of the volume of stays. Every other Canadian province put together accounts for 13%, Americans for 7%, and the rest of the world for 3%.
Spending tells a different story from volume, and it is the more useful one for understanding how the city trades. Quebecers generate 45% of tourism spending, the rest of Canada 16%, Americans 24%, and other countries 15%. Americans are 7% of the stays and nearly a quarter of the money. That gap is why the American market gets attention here out of all proportion to its headcount.
The American share has grown steadily since 2015 but remains below what the city’s profile in US travel media would predict. The reasons are straightforward: the language, the two-and-a-half hour flight from most US markets, and the competing draw of Montréal two hundred kilometres closer.
Seasonality is the defining commercial feature. July and August carry a disproportionate share of the annual visitor count, with the Festival d’été (early July) and the Fêtes de la Nouvelle-France (early August) acting as the two largest single draws. A second peak runs from mid-December through mid-March, driven by the Christmas market in the Old Town and the Carnaval de Québec in late January-early February. The shoulder seasons, April-May and October-November, are considerably quieter; some restaurants and attractions close for several weeks each year.
When visitors actually come
The cruise-ship business has grown substantially since the Port of Québec began dedicated investment in cruise infrastructure in the early 2000s. The Port of Québec reports approximately 145,000 cruise passengers in 2024, carried by 118 ships over a season running from 10 April to 29 October — the longest in its history (Port of Québec). Most sail itineraries between Boston or New York and the Canadian Maritimes. A cruise passenger spends far less ashore than an overnight visitor, but the volume matters to downtown retail and restaurants on shoulder-season days.
Hotel supply concentrates across the Vieux-Québec (the highest concentration), Grande Allée and Sainte-Foy, and a long tail of smaller properties in the outer suburbs and along the Highway 40 corridor. Short-term rentals add a further layer of supply that the Ville de Québec has sought to constrain through a registration requirement. Occupancy follows the visitor curve closely: near-full in July and August, thin by November.
What the tourism economy is worth
Room rates track the same seasonality, peaking in July and August and falling sharply by November. Vieux-Québec carries a consistent premium over the Sainte-Foy hotels, which is why business travellers tend to stay on Boulevard Laurier and leisure travellers inside the walls.
Visitor origin markets are shifting. Ontario has grown as a source market, helped by the Via Rail connection and by the repositioning of Québec City in Toronto-market advertising. The US Northeast (New York, Massachusetts, New Jersey, Connecticut) accounts for the bulk of American visitors, with a secondary cluster from the US Midwest. International markets are led by France, followed at a distance by the United Kingdom, with a smaller spread from Belgium, Switzerland, Germany and Japan.
Québec City is primarily a short-break destination: overnight stays are shorter here than in Montréal or Vancouver. The pattern reflects both the compact walkable scale of the city and how often it is visited as one stop on a longer Canadian itinerary rather than as a single destination.
Where the pressure falls
Concerns about over-tourism are real but more localised than in Barcelona or Venice. The Quartier Petit-Champlain in summer, the Citadelle on cruise-ship days, and the Château Frontenac photo corner are the obvious pressure points. The Ville de Québec’s 2022 tourism master plan set goals of flattening the seasonal curve, dispersing visitors toward Saint-Roch and Limoilou, and capping short-term rentals in the Vieux-Québec. Progress has been uneven.
For a visitor planning a trip, the practical implications are straightforward. May, June, September, and October offer the best combination of availability, weather, and price. July and August offer the most activity but at the highest cost and with noticeable crowding. November and April are cheap and quiet but with weather that limits what can comfortably be done outdoors.
The numbers, from the tourism board
Destination Québec cité publishes the regional tourism figures each year. The current set is for 2025, from the economic fact sheet it issued in October 2026.
| Indicator | 2025 |
|---|---|
| Tourist stays in the Québec City region | 6.7 million |
| Tourism spending in the regional economy | $2.7 billion |
| Average spending per stay | $405 |
| Average nights per stay | 2.1 |
| Jobs in tourism-related sectors | 34,643 |
| Wages paid in those sectors | $1.294 billion |
| Businesses in tourism-related sectors | 2,059 |
| Net foreign currency inflow | $1.05 billion |
The prior-year set, below, is kept for comparison. Note again that 2024 was reported in tourists and 2025 in stays, so only the money, the jobs and the currency lines can be read down the two tables.
| Indicator (prior year) | 2024 |
|---|---|
| Tourists received in the Québec City region | 4.3 million (4.0 million in 2023) |
| Tourism spending in the regional economy | $2.5 billion |
| Tax revenue generated, provincial and federal | more than $600 million |
| Regional jobs linked to tourism | 38,341 |
| Foreign currency injected into the Québec economy | $1.1 billion |
Two things are worth reading out of the 2024 table. The 4.0 to 4.3 million move was a record year, not a rebound to a previous peak. And the ratio of spending to visitors works out at roughly $580 a head — a figure derived from the two published totals above, not a separately reported statistic. Spending has gone on rising since: the $2.5 billion of 2024 became $2.7 billion in 2025.